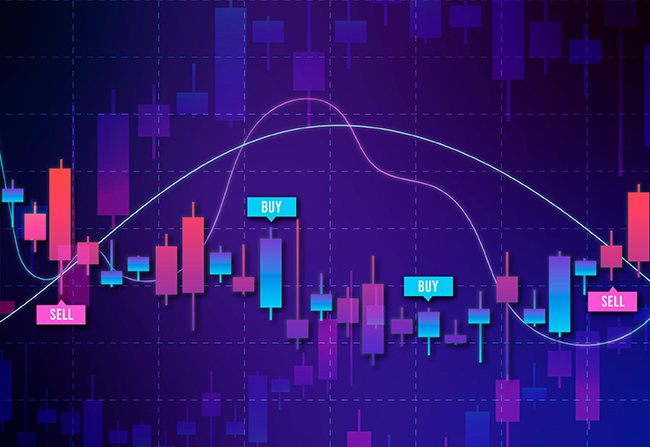
Candlestick patterns are one of the most widely used tools in technical analysis. These patterns provide visual insights into market sentiment and can help traders predict future price movements. They are especially popular in day trading and swing trading because of their simplicity and effectiveness in conveying market psychology. Understanding how to read and interpret candlestick patterns is a key skill for anyone looking to succeed in the markets.
Candlesticks represent price action over a specific time period, with each “candlestick” consisting of a body and two wicks (also known as shadows). The body represents the opening and closing prices of an asset, while the wicks show the highest and lowest prices reached during that period. By looking at the shape and relationship between the open and close, traders can gauge whether the market is bullish or bearish, and use this information to inform their trades.
What Candlestick Patterns Tell You?
Candlestick patterns are often used to reflect the emotions driving the market. The size and shape of the body, the length of the wicks, and how candlesticks are positioned relative to each other can reveal whether buyers or sellers are in control. Traders use candlestick patterns to understand current market sentiment, such as whether the market is moving towards a trend or preparing for a reversal.
In general, long candlesticks with a wide body indicate strong momentum, while small candlesticks suggest indecision. Candlesticks with long upper or lower wicks show that price attempted to move in one direction but was rejected, suggesting that buyers or sellers are losing strength.
Common Candlestick Patterns:
There are many different candlestick patterns, but some are more commonly used than others due to their reliability in predicting price movement. Here are some of the most widely recognized candlestick patterns:
Doji:
The Doji is formed when the opening and closing prices are nearly the same. This pattern indicates market indecision, as neither buyers nor sellers have taken control. Depending on its position in a trend, a Doji can signal a reversal or continuation.
Hammer and Hanging Man:
These patterns look similar but have different implications. A Hammer occurs during a downtrend and suggests a potential reversal to the upside. It has a small body at the top of the candle with a long lower wick, indicating that sellers initially controlled the price, but buyers gained momentum by the end of the period.
The Hanging Man, in contrast, occurs at the end of an uptrend and may signal a reversal to the downside. It looks like a Hammer but after a prolonged upward price movement, indicating that the market may be exhausted.
Engulfing Patterns:
Engulfing patterns are formed when a small candlestick is followed by a larger candlestick that completely engulfs the previous one. A Bullish Engulfing pattern occurs when a small red candlestick is followed by a larger green one, signaling that buyers have taken control. A Bearish Engulfing pattern happens when a small green candlestick is followed by a larger red one, indicating that sellers are now in control.
Morning Star and Evening Star:
These are three-candle patterns that signal a potential reversal. The Morning Star appears at the bottom of a downtrend and consists of a long bearish candlestick, followed by a small-bodied candle (usually a Doji), and then a long bullish candle. This pattern indicates that a reversal from bearish to bullish momentum is possible.
The Evening Star is the opposite, signaling a potential top. It consists of a long bullish candlestick, followed by a small-bodied candle, and then a long bearish candlestick. This pattern suggests a shift from bullish to bearish sentiment.
How to Use Candlestick Patterns in Trading?
Candlestick patterns are most effective when used in conjunction with other technical indicators and chart analysis. For example, combining candlestick patterns with trend lines, support and resistance levels, or volume analysis can provide confirmation of a potential price move. Relying on candlestick patterns alone can sometimes be misleading, so it’s important to cross-check patterns with other aspects of market analysis.
To use candlestick patterns effectively, start by practicing on charts. Focus on identifying key patterns in both trending and ranging markets. As you become familiar with these patterns, you’ll start to recognize how they fit into the overall market structure. Keep in mind that candlestick patterns work best in markets that have clear trends or at major turning points.
How to Interpret Candlestick Patterns with Market Context?
Candlestick patterns should never be interpreted in isolation. Their significance often depends on where they appear in a trend. For example, a Bullish Engulfing pattern at the bottom of a downtrend can be a strong reversal signal, while the same pattern during an uptrend may indicate continuation rather than a reversal.
Likewise, understanding the broader market context is crucial. In highly volatile or choppy markets, candlestick patterns can be less reliable due to the constant back-and-forth movements. In such cases, it’s important to wait for additional confirmation from other indicators or price action before making a trade.
Practical Tips for Trading with Candlestick Patterns:
Practice and Patience:
Identifying candlestick patterns can take time, especially when you’re just starting out. Spend time analyzing historical charts to become more familiar with common patterns and how they behave in different market conditions.
Look for Confirmation:
Never trade solely based on a single candlestick pattern. Wait for confirmation through other indicators or price action before entering a trade. For example, after spotting a bullish reversal pattern, check for confirmation in the form of a break of resistance or increased volume.
Use Proper Risk Management:
Like any other form of technical analysis, candlestick patterns should be part of a larger trading strategy. Always use stop-loss orders and proper risk management to protect yourself from unexpected market moves. Patterns are helpful, but they’re not foolproof.
Conclusion:
Candlestick patterns are a valuable tool for traders, offering clear and easy-to-read signals about market sentiment and potential price movements. By learning to identify key patterns and understanding their context within the overall market structure, you can improve your ability to predict market direction and make better-informed trading decisions.
However, it’s important to remember that candlestick patterns are not infallible. They are best used in combination with other tools and strategies to create a comprehensive approach to market analysis. With practice and discipline, candlestick patterns can become an integral part of your trading toolkit, helping you make more confident and successful trades.


