Volume is a critical yet often overlooked aspect of trading. It represents the number of shares, contracts, or units of an asset traded during a specific period. Unlike price, which tells you what is happening, volume tells you how significant that movement is. By incorporating volume analysis into your strategy, you can gain a deeper understanding of market behavior and improve your trading decisions.
At its core, volume reflects the activity level of a market. Higher volume indicates greater participation, which often validates price movements. For instance, a stock breaking out of resistance with high volume is more likely to sustain its trend than a breakout on low volume. Understanding how to read and interpret volume data is essential for traders aiming to distinguish strong trends from false signals.
Why Volume Matters in Trading?
Volume provides insight into the strength and sustainability of price movements. When price rises or falls on high volume, it indicates strong conviction among market participants. Conversely, low volume suggests uncertainty or a lack of interest, making price movements less reliable.
For example, imagine a stock rising sharply in price, but the volume is significantly lower than its average. This could indicate that the movement is driven by a small group of participants and might not be sustainable. On the other hand, a price increase accompanied by high volume suggests widespread buying interest and a higher likelihood of continuation.
Volume and Trends
Volume is particularly useful for confirming trends. In an uptrend, volume should increase as prices rise and decrease during pullbacks. This pattern indicates strong buying interest during rallies and minimal selling pressure during corrections. In a downtrend, the reverse is true—volume increases during price declines and decreases during recoveries, signaling strong selling pressure.
Divergences between price and volume can also signal potential reversals. For instance, if a stock continues to rise while volume steadily declines, it might indicate weakening demand, making the uptrend vulnerable to a reversal. Paying attention to these signs can help traders avoid being caught in failing trends.
How to Use Volume in Your Trading Strategy?
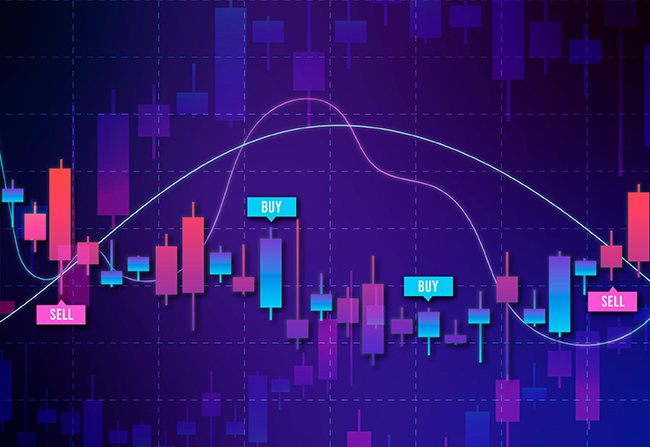
To incorporate volume into your trading, start by observing its relationship with price. Look for patterns such as:
- Breakouts and Volume
When an asset breaks through a significant support or resistance level, volume should ideally increase. A breakout with low volume may signal a lack of conviction, increasing the chances of a false breakout. - Volume Spikes
Sudden, unusual spikes in volume often accompany major market events, such as earnings announcements or news releases. These spikes can signal the beginning of a new trend or a sharp reversal. - Volume and Consolidation
During periods of consolidation, volume tends to decrease. A breakout from consolidation with a significant increase in volume often confirms the new trend’s strength.
Tools for Analyzing Volume:
Modern trading platforms offer tools to make volume analysis easier. Common tools include volume bars, moving average volume indicators, and the volume-weighted average price (VWAP).
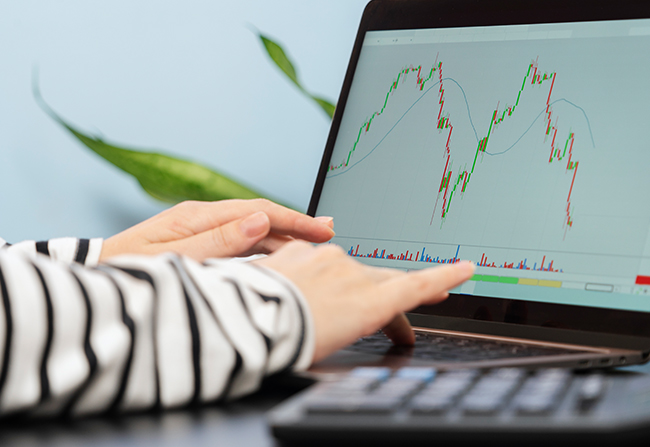
- Volume Bars: Found at the bottom of most trading charts, these bars show the total volume for each time period. Comparing these bars over time reveals whether activity is increasing or decreasing.
- Moving Average Volume: This tool smooths out volume data, allowing traders to identify trends in participation levels. For instance, an asset consistently trading above its average volume may indicate a strong trend.
- VWAP: This indicator combines price and volume data to provide the average price of an asset weighted by volume. It’s particularly useful for intraday traders seeking to identify value areas.
Volume in Different Markets:
Volume behaves differently across markets. In the stock market, volume data is readily available and often straightforward to analyze. In forex, however, volume data is decentralized, so traders use tick volume—measuring how often the price changes—as a proxy.
Cryptocurrency markets present unique challenges and opportunities. Volume data is easily accessible on platforms like Binance or Coinbase, but it’s important to cross-check data from multiple exchanges to ensure accuracy due to their fragmented nature.
Common Mistakes When Using Volume:
Traders often misinterpret volume by assuming high volume always equals strong trends. While high volume often validates price action, it’s crucial to consider the context. For example, a high-volume day during a market selloff could signal panic selling rather than a healthy trend.
Another mistake is relying on volume alone without considering other factors like price action, market conditions, or broader trends. Volume should be used as a complement to your existing strategy, not a standalone signal.
Conclusion:
Volume is a powerful tool that provides insight into the strength and sustainability of price movements. By learning how to interpret volume data, you can identify strong trends, avoid false breakouts, and make more informed trading decisions. Whether you’re analyzing breakouts, consolidations, or potential reversals, understanding volume helps you better navigate the complexities of the market.
Incorporating volume into your trading strategy requires practice and patience, but the payoff is worth it. As you gain experience, you’ll find that volume analysis adds an invaluable layer of confidence to your trades, setting you apart from less-informed participants.