Technical analysis is a critical tool for traders looking to predict future price movements based on past market data. Whether you’re trading stocks, forex, or cryptocurrencies, understanding how to analyze price charts and use technical indicators can help you make informed decisions and improve your trading strategy.
In this article, we’ll explore the basics of technical analysis, key concepts, and how you can use it effectively in your trading.
What is Technical Analysis?
Technical analysis is the study of historical market data, primarily price and volume, to forecast future price movements. Unlike fundamental analysis, which focuses on a company’s financial health, economic factors, and other external variables, technical analysis assumes that all information is already reflected in the price. It relies on charts, patterns, and various technical indicators to identify trends and market signals.
At its core, technical analysis is about understanding price patterns and recognizing trends. By analyzing how price has moved in the past, traders try to predict future price movements. The idea is that historical price trends tend to repeat over time, allowing traders to make educated guesses about future price behavior.
Key Concepts in Technical Analysis:
To begin using technical analysis, there are several key concepts you need to understand. These include charts, trends, support and resistance levels, and technical indicators.
- Charts:
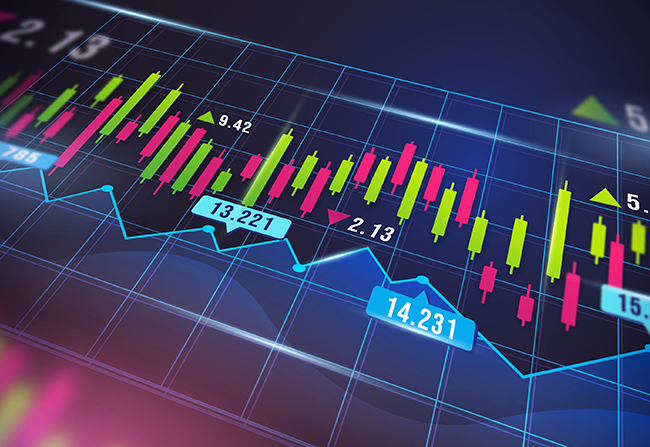
A chart is a visual representation of a market’s price over time. The most common type of chart is the candlestick chart, which shows the open, high, low, and close prices for a given time period. Candlestick charts are widely used because they provide detailed information about market activity and trends. - Trends:
A trend is the general direction in which the price of an asset is moving. Traders typically identify three types of trends:- Uptrend: Prices are rising, and higher highs and higher lows are being made.
- Downtrend: Prices are falling, and lower highs and lower lows are being made.
- Sideways (Range-bound) Trend: Prices are moving within a horizontal range, with no clear upward or downward movement.
- Recognizing trends is vital for technical traders because they use these trends to determine entry and exit points.
- Support and Resistance Levels:
Support refers to a price level at which an asset tends to find buying interest, preventing the price from falling further. Resistance is a price level at which selling interest is strong enough to prevent further price increases. These levels are important because they often act as barriers, and price movements tend to reverse when these levels are reached.
Popular Technical Indicators:
Technical indicators are mathematical calculations based on the price, volume, or open interest of an asset. These indicators help traders identify trends, momentum, volatility, and market strength. Here are a few popular technical indicators that traders often use:
- Moving Averages (MA):
A moving average smooths out price data over a specified period to create a single flowing line, which helps to identify trends. The two most common types are:- Simple Moving Average (SMA): This is the average of an asset’s price over a specified period, like 50 or 200 days.
- Exponential Moving Average (EMA): This gives more weight to recent prices and reacts faster to price changes than the SMA.
- Relative Strength Index (RSI):
The RSI measures the speed and change of price movements to identify overbought or oversold conditions in the market. The RSI ranges from 0 to 100, with values above 70 indicating that the asset may be overbought, and values below 30 suggesting it may be oversold. - Moving Average Convergence Divergence (MACD):
The MACD is a trend-following momentum indicator that shows the relationship between two moving averages of an asset’s price. It’s particularly useful for identifying potential buy or sell signals based on crossovers and divergence from the price trend. - Bollinger Bands:
Bollinger Bands consist of a simple moving average (SMA) and two standard deviation lines that create a band around the price action. The bands expand when volatility increases and contract when it decreases, helping traders spot potential breakouts or reversals.
How to Use Technical Analysis in Your Trading?
Now that you have a basic understanding of technical analysis, let’s discuss how to incorporate it into your trading strategy.
- Identify the Trend:
The first step in technical analysis is to determine the overall trend of the asset. Are prices in an uptrend, downtrend, or moving sideways? Once you identify the trend, you can adjust your strategy accordingly. For example, you might choose to buy in an uptrend and sell in a downtrend. - Use Support and Resistance Levels:
Support and resistance levels help you identify potential entry and exit points. When prices are approaching a support level, traders often look for buying opportunities, expecting the price to bounce back. Similarly, when prices approach resistance, traders might look to sell or take profits, as prices often reverse at these levels. - Combine Multiple Indicators:
While no single technical indicator is perfect, combining different indicators can give you a more reliable signal. For example, you might look for a confluence of signals, such as an RSI showing oversold conditions and a moving average crossover, to confirm that a trade is worth taking. - Use Stop-Loss and Take-Profit Orders:
Even with technical analysis, markets are unpredictable, and not every trade will be successful. To manage risk, always set a stop-loss order to limit potential losses and a take-profit order to lock in profits when your target price is reached.
Limitations of Technical Analysis:
While technical analysis is a powerful tool, it’s important to remember that it has limitations. Price movements are influenced by many factors, including economic data, political events, and market sentiment. Technical analysis does not account for these external factors, which means it can sometimes produce false signals.
Additionally, technical analysis relies on historical data to predict future movements, but past performance does not guarantee future results. Therefore, it’s essential to use technical analysis in conjunction with other tools, such as risk management techniques, to improve your chances of success.
Conclusion:
Technical analysis is an essential skill for traders looking to make informed decisions and improve their chances of success. By studying price charts, recognizing trends, and using technical indicators, traders can predict future price movements and identify profitable opportunities. However, technical analysis is not foolproof, and it’s important to use it alongside solid risk management practices and a well-defined trading plan.
As you become more familiar with technical analysis, you’ll be able to refine your strategies, spot high-probability setups, and make smarter trading decisions. With time, patience, and practice, you can harness the power of technical analysis to improve your trading results.


